Under the REFRAME project the IO3: CE Transition Framework specifically for small and medium businesses in the construction, manufacturing and crafts industries has been developed, which helps them become friendlier to the environment. It provides the EU construction & manufacturing SMEs and micro-enterprises’ employees and future employees with practical knowledge on implementing CE transition in their business. The CE Framework includes a set of methodology concepts, tools and measurement instruments that guide the execution of CE strategy adoption.
The CE Framework includes:
Analysis of the following factors as per REFRAME target groups: Organizational, Financial, Political, Legal, Social, Environmental, Technical and Knowledge and Supply Chain Factors
Implementation Framework Process Model
Risk and Opportunities Management Process: Any change in a business environment may cause risks that might threaten an SME’s existence if not identified at an early stage, like changes in business processes, products and services, suppliers, business model etc. Such risks should be identified, assessed, evaluated and treated for SMEs to monitor CE transition and meet its predefined objectives.
A Sector-Specific Circular Economy Strategy per Target Group (Construction, Manufacturing and Crafts), which will help SMEs & micro-enterprises to:
Re-design a Circular Business Model: This needs to be done mostly because regular business models are based on a linear economy where a basic principle is an adding value to a particular product whereas in a CE the principal is to maintain each product’s value.
Re-design a Circular Business Processes: Once an SME implements a CE, it shall modify its processes for fundamental CE principles to be satisfied (e.g. reuse potential and recyclability of industrial and other products). Circular Processes aim to assist construction and manufacturing SMEs and micro-enterprises in fundamentally rethinking how they do their work to improve Circularity.
Re-design a Circular Products and Services: Re-design of existing products and services shall occur for new products to be easy to maintain, repair, upgrade, refurbish or remanufacture.
Prioritisation Model, with prioritised activities that need to be done to succeed in the above.
The purpose of the Context of the organisation Procedure is to outline your organisation’s process for the identification and determination of internal and external issues, interested party requirements, processes that relate to a potential Circular Economy transition, and which influence the strategic direction (where we’re going) and our operational purpose (what we make and do). Below, the most critical factors for understanding your business context have been identified and described.
1.1. Organisational factors
1.2. Financial factors
1.3. Political factors
1.4. Legal factors
1.5. Social factors
1.6. Environmental factors
1.7. Technical and knowledge factors
1.8. Supply chain factors
Concluding remarks
The successful transition of SMEs and micro-enterprises, like any business, to CE, requires a deep understanding of the factors involved. The international literature recognises the following factors in general, i.e. Organisational, Financial, Political, Legal, Social, Environmental, Technical and knowledge, Market and Supply chain, which may act as both drivers and barriers. This document offers a methodological approach to facilitate SME/micro-enterprise owners and managers to assess the broader operational environment of their business. In this direction, the most important factors are analysed and, for each factor, several questions are provided to guide those taking responsibility for the transition of the business to a CE framework.
Having understood the CE Framework, construction, crafts and manufacturing SMEs and micro-enterprises can then implement the transition to the CE by using both the self-rate tool results and the educational material that has been created in the context of the project. To further help the users, the REFRAME has also created the iLearn Tool (IO4), which includes the CE S-R Tool, the CE Course and the CE Framework. The user may use the S-R Tool and get personalised results in terms of a proposed step-by-step guide (CE Framework) on how to implement CE processes for the company and a proposed learning pathway (CE Course) that should be studied to be able to implement the CE processes.
Introduction
Any change in a business environment of an organisation, such as a CE initiative, presents risks that might affect not only its ability to achieve its strategic objectives and results but also threaten its very existence if not identified at an early stage and treated timely.
A company’s transition to a more CBM constitutes a major change. This change could range from a “green” product development project to a major change management program, comprising a multitude of projects, many of them interrelated and interdependent.
Thus, several risks might occur and eventually threaten the successful transition of the organization to its future. Such risks should be identified, analysed, evaluated and treated accordingly, and promptly. Some risks will be common across all projects and some will be project-specific. Through this analysis, positive risks might also be found that could reveal opportunities leading, for example, to new business, new markets, cost efficiencies or improved processes.
Concepts from ISO31000 and ISO14001 are used, along with Project Risk and Change management best practices, found in the “PMBoK Guide” and related literature.
Finally, to assist the target groups to start exploring and tailoring the Risk/Opportunity Register to their unique environment and projects toward a CE business model, an indicative list of respective Risks and Opportunities is presented.
01
Risk
An uncertain event or condition that, if it occurs, has an impact on at least one project or business objective.
02
Opportunity
An uncertain event or condition that may have a positive effect on a project or business objective, if pursued.
03
Risk and Opportunity Management Process
The continuous and proactive process of identifying program/project risks and opportunities, analysing & evaluating them, planning adequate treatment responses, implementing treatment action plans, and monitoring those plans to completion.
04
Components of Risk
An event that may or may not happen (threat/ risk event)
The probability of the occurrence of that event
The impact of the occurrence of that event
05
Risk appetite
is the level of risk that an organization is prepared to accept in pursuit of its objectives before action is deemed necessary to reduce the risk. It represents a balance between the potential benefits of innovation and the threats that change inevitably brings. The ISO 31000 risk management standard refers to risk appetite as the "Amount and type of risk that an organization is prepared to pursue, retain or take".
06
Residual risk
Whatever risk level remains after planned responses are applied.
07
Risk Register
A living repository document, in which outputs of the risk management process are recorded and updated for the duration of the project/program.
Information can include: risk ID, category, project (optional), risk owner threat/risk event statement (a.k.a. risk description), detection trigger (how we will know that the risk event happened - optional), probability, impact, risk score, ranking/priority, response strategy, response plan(s) (could contain references to separate plan documents, control or measures), residual risk (updated after every implementation of a response strategy), any other information with the purpose to get a high-level understanding of risks & their status
08
Opportunity Register
A living repository document, in which outputs of the risk management process are recorded and updated for the duration of the project/program.
Information can include: opportunity ID, category, project (optional), opportunity owner, opportunity event statement (a.k.a. opportunity description), detection trigger (how we will know that the opportunity event happened - optional), probability, (positive) impact / benefit, opportunity score, ranking/priority, response strategy, exploitation plan(s) (could contain references to separate plan documents), any other information with the purpose to get a high-level understanding of opportunities & their status
To avoid confusion, from this point on -unless otherwise noted- this document and the respective terminology will be focused on Risks. However, it should be relatively simple for the dedicated learner to adapt the process to opportunities, instead of risks.
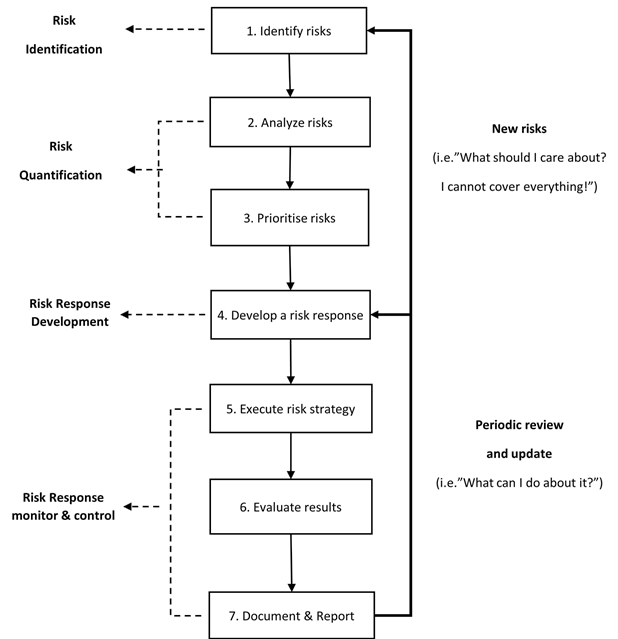
The Risk management process has four (4) phases which comprise seven (7) steps.
During the CE transition, many structural changes in business might occur within the company, generating thus new risks that should be identified at an early stage. Specifically, areas that should be carefully examined for generating new risks are the following:
New CE Business Model
New CE re-engineered Business Processes
New CE Business Products and Services
Risk identification is the comprehensive identification of potential risk events, using a structured and consistent approach, and the reduction of ambiguity in the description of the risk event under study. Risk identification should be performed not only during project planning but continuously throughout the project life cycle.
Both internal and external risks should be identified:
Internal risks
can be controlled or influenced by the project or planning team, such as resource assignments & availability, schedule and cost estimates, and contract type.
External risks
are those risks beyond the control of influence of the project or planning team, such as customer decisions, market shifts or government actions.
The effectiveness of the entire risk management process is only as good as the quality and specificity of the threat event statements.
The following are two (2) recommended general formats for threat event statements:
“ _ _ _ _ _ _ may occur during _ _ _ _ _ thereby causing an impact to _ _ _ _ _ _ _”.
“If _ _ __ _ _ _ occurs, then an impact to _ _ _ _ _ _will occur”.
It is very helpful to use categories to identify additional risks. The organization should use its understanding of its Context (as defined in IO3-A2) as another source of risk categories, as well as risks as such.
Effective risk identification should involve group techniques. The most common tools and group techniques that are used in Risk Identification are the following:
Expert interviews
Brainstorming
Delphi technique
Nominal group technique (NGT)
Crawford slip
Analogy method
SWOT analysis
and of course, existing Checklists, Questionnaires and Templates (based on lessons learned and the idea that no new project represents a completely new set of risks as well).
All the above information about the identified risks is recorded in the Risk Register, to proceed with Risk Analysis.
The identified risks are analysed to determine the probability of occurrence of each event and its impact if it does occur. Risk analysis involves quantifying and prioritising risks to assess the range of possible project/program outcomes. It is primarily concerned with determining which risk events warrant a response.
It should be noted that this analysis is complicated by several factors:
Risks may interact in unanticipated ways.
A single risk event may cause multiple effects.
An opportunity for one stakeholder (e.g. reduced cost) may be a risk to another (e.g. reduced functionality).
Not all risks are quantifiable - some can only be defined qualitatively.
If mathematical techniques are used in quantification, they may give the false impression of precision and reliability. Trying to guess and apply quantitative values to events that are unpredictable in terms of probability of occurrence and impact, could convey a false impression of accuracy, and therefore be misleading.
In estimating the probability and impact of risk events, quantitative values should be assigned when there is a reasonable degree of certainty or confidence in the validity of those quantities. In the absence of quantitative analysis capability, qualitative methods should be used.
Having estimated the probability and impact of each threat event, the overall risk rating is calculated as follows:
Probability x Impact = overall Risk Score
Below is a suggested qualitative “Risk Heat Matrix” to be used for probability and impact estimations, along with their respective “Risk Score Ranges”. It is recommended to always use an even number of options for each axis (1 to 4 in our example), to discourage project team members to choose the “middle ground” when estimating, and to make them think and decide if their estimation is going to be above or below the median value.
The estimations for Probability, Impact, and Risk Score, are then entered in the Risk Register, for each risk.
Although it is important to identify all risks, in many projects the number of risks identified may be overwhelming. The project team cannot effectively track and manage all of them. Therefore prioritising the risks is important so that the team can focus its effort on the most critical ones—those risks that can do the most harm.
For each risk identified and documented on the Risk Register, the team must prioritise which risks need to be addressed immediately with the development of a mitigation strategy and which ones need to be tracked, monitored, and reported. How many risks the team selects for immediate action will depend on factors such as the impact of the identified risks, the number of risk events, and the type of risks. The team should first concentrate on risks with an overall rating of “H” (High) or “MH” (Medium-High).
Although the team may elect not to focus on some risks determined to have a moderate or low overall score -i.e. “ML” (Medium-Low) or “L” (Low)- these risks must be tracked and monitored, because their probability of occurrence and their impact may change as the project progresses. What was initially considered a low risk may suddenly become a risk with a high impact.
Finally, update the Risk register with the evaluation & prioritisation results.
Developing the risk management strategies also referred to as risk response development entails identifying various risk mitigation strategies for each risk, evaluating the effectiveness of each option, and selecting the best approach. For every risk, several strategies or alternatives may be applicable. The project team must identify these alternatives, evaluate their merits, and select the one that offers the best solution.
Each organization will decide which risks to treat and to what degree, according to its Risk appetite, but a common and general rule is the following:
High Risks are not acceptable and should be treated as a must.
Medium-High risks must be treated for those risks with high impact. Lower impact risks (in the same medium-high range) might or might not be treated.
Medium-Low risks with an impact of 3 need to be treated. Lower impact risks (in the same medium-low range) might be acceptable.
Low risk is usually acceptable.
Regardless of their score, all risks should be monitored at various intervals, in case their score changes throughout the project.
The four (4) basic risk response strategies are listed below:
Avoidance: eliminating a specific risk, usually by eliminating the cause or reorganizing the project structure, which changes the situation so that the risk cannot affect the project.
Mitigation: reducing the probability of occurrence or the impact if it does occur. If you choose this risk response strategy for a certain threat, you should implement one or more controls (measures that modify the overall risk). Controls might include policies, procedures, practices, technical measures, devices and any other actions that mitigate the overall risk. For example: establish firm resource commitments for tasks at risk, establish a management reserve to handle potential cost overrun, monitor and manage the technical performance of tasks having a high-risk factor, etc.
Transfer: transferring all of, or part of, the risk to another party. The probability of occurrence is not reduced or eliminated, but the consequences to the organization are minimized. Such is the case when subcontractors are used, or if the organization buys insurance.
Acceptance: demonstrating awareness of the risk and willingness to accept the consequences if the risk occurs. There are two (2) acceptance options possible:
Passive: this is a conscious management decision to take no action.
Active: develop a contingency plan and execute it, should the risk event occur.
The three (3) basic opportunity response strategies are listed below:
Ignore: do nothing
Enhance: increase the expected value of an opportunity, trying to:
Maximise the probability
Maximise the value of the (positive) impact or benefit.
Pursue: plan for the potential opportunity by ensuring the respective cause occurs
Finally, as usually, update the Risk register with the response plans, controls and measures.
The risk management process and the planned responses must be continuously evaluated and updated throughout the CE initiative program and projects. Assessing the effect of the risk response plans, making adjustments if necessary, and updating the plans as necessary, are essential to managing project risks effectively. The risk management plan and its effectiveness should be evaluated at least:
Periodically, at specified intervals, throughout the project
At major project milestones
Risk events, their probability of occurrence, and their impact are constantly changing. New risks emerge and old ones disappear. Implementing risk mitigation actions may create new risks, which were not predicted, or change the effects of existing ones. Therefore, evaluating the plan periodically is critical and periodic reviews should be specified in the project schedule.
Major milestones are also logical points in the project management life cycle to evaluate how the project is doing and assess changes in the environment. Every time a major project change is proposed and approved for implementation, the project team should look at how this change affects the project and determine if any new risks are introduced by the change. New mitigation strategies will need to be developed to address any new risks.
In assessing and updating the risk management plan, perform the following steps:
Review
the risk mitigation actions that have been implemented to date, for effectiveness and the need for further action.
Evaluate
the major risk events for tasks currently being implemented and for those to be implemented in the near future, to see if anything has changed or if the strategies should be modified.
Identify
any new risks, analyse them, incorporate them into the overall risk management process, and develop corresponding risk mitigation strategies.
Develop
new mitigation strategies or modify old ones, if the current strategy works poorly or further mitigation is necessary.
Update
the project plan, as appropriate, to reflect changes in the risk management plan.
Escalate
management of the risk if known risk thresholds are increased.
Document the risk management efforts in the Risk Register, to provide a historical trail of the project team's actions and results. It is through this effort that the organization can learn from experience. Similar to lessons learned, this documentation provides the organization with valuable information on which strategies and actions have worked and which have not. The risk management documentation should be kept as simple as possible, but it should be current, complete, and accurate.
Quite a few generic risks (i.e. not project-specific) have already been identified in the literature. The important thing here is to use the categories to identify as many relevant risks (and opportunities in the next section) as possible, and not to worry if a risk is categorised under “Political” whereas it should be under “Legal”. After all, a risk may belong to more than one category.
Risk Category: Organisational
Lack of change management mindset & capabilities/experience
Lack of innovative company culture
Pressure from shareholders/investors to achieve sustainability
Lack of key resource management capabilities/experience
No formal inclusion of CE principles in the strategy, objectives and performance indicators
Very low-risk appetite
Many hierarchy levels
Lack of employee involvement & participation
Lack of top-management support (of course this is a classic risk for all major change initiatives, regardless of the objective)
Risk Category: Financial
High up-front investment cost (e.g. for new products’ equipment & processes, “green” innovation)
Higher operating costs for CE business models (e.g. collecting, sorting & recycling waste material)
Difficult access to operational and/or investment capital (e.g. when it comes to bank financing, SMEs -and especially very young small businesses- face difficulties in obtaining the collateral or guarantees required by the banks, which often consider SME financing a risky business)
Cash flow risks (e.g. delayed cash flows as a result of pay-per-use models)
SMEs may neglect the possible financial gains from improving their resource efficiency, and also consider resource efficiency practices to be costly for their business
Risk Category: Political
Insufficient regulations for CE, not covering all industry/SME sectors
Lack of government agencies to assist SMEs in the transition to CE
Risk Category: Legal
The inflexibility of national & EU legislative framework and slowness of change/adaptation to CE existing and emerging requirements
Warranty, maintenance/support and/or take back contractual and regulatory obligations and in general the responsibilities in case of malfunction
Most tools for environmental management (such as the European Eco-Management and Audit Scheme - EMAS) are produced for larger companies, without taking into account the specificities of the SME sector
Lack of clarity on several concepts of EU legislation (such as producer responsibility, quality of separate collection and definitions of recycling, re-use and recovery)
Risk Category: Social
Public health risk (by using recycled materials or reusing raw materials)
Many consumers are still focused on convenience and low-priced products
Many consumers consider remanufactured products as low quality
Changes in consumer base, perception, and behaviour (including fashion and lifestyle)
Risk Category: Environmental
Customers are less sensitive to products that can be handled easily after their use.
Low “eco-literacy” for many SMEs
Substantially increased administrative burdens stemming from environmental legislation
SMEs lack the specific knowledge & capacity to comply with the necessary environmental requirements (as a result, they often rely on external consultants at an extra cost)
Risk Category: Technical & Knowledge
Use of unproven technologies
Professionals lack awareness, knowledge and understanding of CE
Most products are not designed for disassembly (e.g. buildings)
Many SMEs do not have the technical capacity to identify, assess & implement more advanced technical options that would enable them to reduce their environmental impacts while realising cost savings
Lack of information (some SMEs are not even aware that circular business models are available and could be beneficial)
Risk Category: Supply chain
A limited number of suppliers offering circular materials
Uncertainty in the quality & volume of the return flows
Absence of network support, both by customers & suppliers, to apply pressure in the direction of green procurement and/or products life extension
The industry is still largely attached to the linear model (the result being, for example, that management does not invest to promote resource efficiency or better waste management, but does invest in a new marketing campaign)
Closed-loop & reverse loop supply chains could increase the cost of logistics, transportation & energy
SMEs due to their small size and bargaining power, have little influence on their suppliers’ engagement in sustainable activities
Suppliers are reluctant to foster a greener supply chain due to the potential costs that could harm their competitiveness
Opportunity Category: Social
Improved relationships between local societies and SMEs
Employment opportunities from the recycling business
Employment opportunities for design graduates & professionals with CE-related expertise
Opportunity Category: Financial/Economic
Resource productivity, material cost reduction & increased revenue from waste sales
Allay demand-driven price volatility of raw materials & supply risk (thus improving the security of raw materials supply)
Reputational advantage
Increased revenue and market share due to increased competitiveness
Waste management could unlock new business opportunities
Opportunity Category: Environmental
Conservation of natural resources (especially non-renewable resources such as water, fossil, fuels, and minerals)
Reduced environmental impacts (through efficient energy and material and less water discharge, avoidance of toxic materials, the extended life cycle of landfill sites, and recovery of the local ecosystem)
Protecting human health and biodiversity
Opportunity Category: Technology
Resource efficiency and waste minimisation (by increased innovation and adoption of cleaner technologies)
Assistance in industrialisation through industrial symbiosis (i.e. the exchange of waste materials between two or more companies)
3.1 Four value drivers of the implementation framework
The transformation of business processes from linear to circular is essential in a resource-constrained world. CE model can effectively tackle global challenges and at the same time create value for the firms that adopt it. Four main value pillars have been identified for SMEs and micro-enterprises implementing CE strategies:
Revenue Generation
Consumers, businesses and governments are getting more and more aware of the environmental impact of the products they buy. They, therefore, are more tuned into sustainability when making their buying decisions. Enterprises adopting CE strategies become aligned with the needs of their customer base and can expect higher revenues.
Cost Savings
Unlike the linear model, employing circular supplies, minimising energy consumption and repurposing waste are all circular strategies that can lead to increased efficiency and overall cost reduction for a company.
Brand Enhancement
Customers prefer supporting green businesses more and more. Thus, circularity can help enterprises from market loss but most importantly enable differentiation from competitors. This means that circular enterprises have a competitive advantage against competitors who remain under the linear model.
Risk mitigation
As resources become more and more scarce, their prices get higher and exhibit higher levels of volatility. By procuring local, circular supplies enterprises can mitigate the risk associated with virgin resource scarcity.
3.2 Four dimensions of Circular Economy implementation
The task of generating revenue and being economically viable while CE strategies are implemented in the Construction, Manufacturing and Crafts business sectors can be demanding. If circular transformation is not done thoughtfully, it may pose a risk to the viability of an organisation. Unlike larger firms where the organisational structure is well defined, SMEs and micro-enterprises typically bring together different business processes under a small number of people. It is common for a handful of people responsible for designing the products, choosing the raw materials, making the products, marketing and involving with the sales.
Cooperation between business processes is important when it comes to implementing circular business models. According to “The circular economy Handbook” (Lacy et al., 2020), firms interested in implementing these models should align their business processes to progress across four fundamental dimensions:
Operations
Products & Services
Culture & Organization
Ecosystem
These transformation dimensions are interdependent and should advance simultaneously, though not necessarily with the same prominence, to gain the greatest traction for CE initiatives.
Below are analysed four dimensions of CE Implementation using the crafts industry as an illustrative case. Yet, they can be taken into consideration for other target groups as well (i.e. construction and/or manufacturing sectors).
The Construction Industry includes the construction (erection), maintenance and repair of:
buildings: residential, industrial, institutional, commercial, and other immobile structures
infrastructure and heavy constructions: roads, highways, tunnels, bridges etc.
service facilities that are integral parts of structures and are necessary for their use.
The construction sector has recently attracted interest in developing performance-based circular models. This is because most of the assets of buildings, such as floors, interior walls, etc., have long-term use phases, high initial costs and significant maintenance costs.
3.3B Strategy: Manufacturing Sector
Manufacturing is defined as any industry that makes products from raw materials by the use of manual labour or machinery and that is usually carried out systematically with a division of labour. In a more limited sense, manufacturing denotes the fabrication or assembly of components into finished products on a fairly large scale.
3.3C Strategy: Crafts Sector
Craft products are considered the ones that require a high degree of handmade input during their production and, many times, are culturally tied to the country of their origin. Historically, crafts used to rely on the local community for a customer base, but today’s digital technology enables craft products to reach broader customer networks. Contemporary craft firms may employ traditional or modern materials and technology in their production and typically their products are produced as a one-off or at a limited number (Fillis, 2004). Crafts encompass a wide range of disciplines and craft products can be anything from home furniture and jewellery to art woodware and metalware, pottery and beer.
3.3A Construction Industry
3.3B Manufacturing Sector
3.3C Crafts Sector
Here you are. You have decided to proceed and apply for CE transition in your company.
You may have come to such a decision for several reasons and motives. The main reason is that such a transition will give you the tools to tackle climate change and biodiversity loss together while addressing important social needs. It will give you the power to grow prosperity, jobs, and resilience while cutting greenhouse gas emissions, waste, and pollution.
Whatever your motivation and following your decision, it is assumed at this point that you have already done your homework and preparation and have identified the areas in need of circular transition. Therefore, you have created a list of all items and areas in need to be changed through the adoption of CE principles and all solutions to be implemented and deployed in your firm.
And here comes the next question: Where do I start from? Which of the listed projects and changes would be the ones I have to implement first, and which can wait (or even be bypassed in the case I do not have many resources to invest)? Is it the fast and quick implemented projects I have to run first and then move to complex ones or is it the cheapest and less complex regardless of the duration? Or should I start from the most complex and demanding ones? How will I identify critical to non-critical projects and sort my list accordingly?
The need for a process to (a) identify criteria that would help me to deal with it and (b) use these criteria to respond to my question is apparent. This specific process is called “Prioritisation”.
Projects and Changes prioritisation is very simple. You can review all the projects and changes you have identified and ask yourself which of these will bring the company the most benefit. Then allocate your resources to these projects. As in several cases, things might be more complex, therefore we require a methodological approach to help us prioritise our identified projects.
A form to use
We will use a specific template/form that will assist us in prioritising our CE projects. You may use the form that is provided in the annexes section of this guide in document and spreadsheet format.
We will call it the Project Prioritisation List and will use it to document and follow up with criteria and factors that affect prioritisation and will assist us in defining our priorities.
The form will also be used to document the defined priority, responsible person for implementation as well as the timeframe of the basic action to implement these projects/changes/systems.
Listing of the projects/changes/systems to be implemented
For this part, you will only need to fill the first three columns of the template.
Column 1 (Project ID) will just be a serial number, starting from 1.
Column 2 (Project / Change / System to be implemented) - The description of the Projects/changes / Systems identified to be implemented in our company.
Column 3 (Depends on – Requires (ID)) is an important column. This is where you will document if there are any dependencies between the various projects. As a dependency, we refer mainly to the case that one project to be implemented requires the implementation of another project to be already implemented and completed when it will start.
For E.g. the deployment of an e-commerce online shop may (not always) require the implementation of an ERP system that will be providing information on the products’ availability to the customers of the e-commerce site. If this is the case, then the ERP system must be implemented first and the e-commerce site second.
Identifying and rating the Urgency
Urgency is a key parameter and reflects the time criticality of a project to be implemented.
Some projects might be urgent due to legal/ compliance requirements or a new environmental regulation while others may be urgent because one of your company’s activities has a very negative impact on the environment and needs to be changed as soon as possible.
Use Column 4 (List of Factors related to Urgency of implementation) to document for each one of the projects in your list, the reasons and the factors that define its urgency status, as well as the degree of urgency. Not all projects are urgent. Some are extremely urgent while others might not be.
Based on the key factors we have identified that affect the urgency of each project, we may use the following rating scale to determine its level of Urgency.
Urgency
Definition
Critical (4)
The project/change/system deployment is necessary to be implemented immediately to prevent severe business loss or impact (e.g. loss due to competition being ahead, or non-compliance with key regulations) or to take advantage of an important business opportunity (e.g. becoming the first fully automated company in our area to support customers fast)
High (3)
The project/change/system deployment is required as soon as possible because of potentially causes business loss or impact or delay in implementation may cause loss of opportunity.
Medium (2)
The project/change/system deployment will reorganize secondary operations and resolve secondary problems or enhance functionality. This project can be scheduled for the middle term.
Low (1)
The project/change/system deployment will lead to certain improvements, changes in operations etc. This change can be scheduled for long term deployment.
We will document our Urgency Value in Column 5 (Urgency value).
Identifying and rating the Impact
We will identify Impact as a measure of the effect that the deployment of a specific project/change/system will have on the company, its business objectives, its operations, its sales, its brand image and reputation, its productivity, its profits and of course its future.
In Column 6 (List of Factors Related to the (positive or negative) Impact of implementation), we can document all impacts (positive or negative) that we will be able to identify for each project/change/system to be implemented. These impacts, as discussed, could be positive or negative. [1]
Positive impacts are those related to the (fast) achievement of business objectives, operational performance improvement, cost-cutting and new customers and market penetration (but not limited to these only).
Negative impacts could be related to a lack of current personnel competencies to support the project (that is, the specific deployment may require an initial investment and effort in training and educating personnel first and then proceed to the implementation of the specific project), capital expenditure and availability (e.g. certain projects may be postponed for next autumn as the cash flow and company economics will then permit the deployment).
Then based on the overall picture we may have (considering positive and negative impacts) we will be able to determine an Impact rate and document it in Column 7 (Impact Value).
The following table lists criteria for determining the impact on our company of the implementation of a project/change system:
Impact
Description
Extensive (4)
There will be extensive business impact (positive an overall) as business objectives are highly supported by the specific project (operations and performance extensive improvement, access to new customers and markets, cost reduction, full compliance with laws and regulations etc. will be achieved).
Significant (3)
There is a significant business impact (positive an overall) as several business objectives are met and/or a good degree of compliance with existing regulations and laws and/or significant cost reduction will be achieved and/or operations performance will be improved or access to a certain market.
Moderate (2)
There is some business impact (positive an overall) as certain business objectives are met and/or a degree of compliance with existing regulations and laws and/or some cost-cutting and operations performance improvement or access to certain markets or customers.
Minor (1)
Minor impact on business improvement (including operations, compliance, cost reduction etc.)
We will document our Impact Value in Column 7 (Impact Value).
[1] Yet it must be clarified that it is not in our current approach step and point to argue whether a specific project is to be implemented or be rejected due to the longlist of or strong negative impacts it may have on the business or in certain business areas. The selection of the project that is required to be implemented has been done at a previous stage (therefore its necessity has been identified at a previous stage).
We document any negative impacts together with the positive, so based on the overall picture, we will be able to determine the correct priority level of each of the projects / changes / systems to be implemented.
Rating the Priority
As discussed already, the calculation of priority of a project/change/system implementation is based on impact and urgency.
You can quantify the Priority of a project by producing a figure that encapsulates the “size” of the priority concerning the significance of its urgency AND impact values. This is done by multiplying together the urgency and impact scores:
Priority Rating = Urgency x Impact
So, we need to go back to our document, calculate and map the priorities ratings of all projects/changes / systems to be implemented.
Priority Matrix
A Priority Matrix is a grid-style “traffic light system” that you can use to help visualize the ratings of your projects. Traffic light colours are used to distinguish between the priorities of the projects and help you define your projects/changes/systems implementation prioritisation better. The scale starts with green (for the least important) and finishes with red (for the most significant and of key priority).
Red= Projects with a significant priority that must be implemented immediately (High)
Orange= Less significant projects concerning the implementation priority, that you should implement after the High ones (Moderate)
Green= Minor priority projects that you will implement last (Low)
Prioritising your projects/changes/systems to be implemented
Based on the above you need to go back to your Project Priority Register and apply this traffic light system to Column 8 (Initial Priority Rating). This will help you with your overall picture of projects’ prioritisation.
Now, you may sort the register list by the Priority rating column, then your picture will be like the one below, making it easy to respond to questions like “Which projects/changes/systems should I implement first?”
Improving Prioritisation by considering dependencies
As discussed above, some projects depend on others and cannot be implemented if the other one is not implemented already or in parallel. In certain cases, a significant (as of its priority) project might be rated in the red area (Column Initial Priority Rating).
If we look at Opportunity ID number 2 at Project B we will see that this project:
first, is rated as a HIGH priority project, and
second, it depends on Opportunity ID number 6 “Project F” which is rated as a LOW priority project.
Typically, we would implement Project B initially because it is of HIGH priority and then implement Project F as it is a LOW priority project.
However, because Project B (ID=2) cannot be implemented unless Project F (ID=6) is implemented, we have to change the priority of Project F to be higher or equal to the priority of Project B. This will ensure smooth and logical implementation and consideration of dependencies.
To deal with such a case we will use Column 9 (Final Priority Rating) to fix the problem. We just copy the already defined priority rating of all projects from Column 8 to Column 9 changing the Priority Rating of Project F from 2 to 6 (6 is the priority rating of Project B). The same applies to any project that depends on another one to be implemented. At the end of this step, we should have considered all project dependencies and rearranged the order accordingly.
As noted, we sort again our template based on the column “Final Priority Rating“. Our final list is as below with all dependencies considered.
Person in charge of the deployment & Implementation time plan
Now our projects have been prioritised and we may proceed to our next step. This is the decision to implement, starting from those of HIGH priority.
We define the person in charge of the project implementation and prepare an implementation time plan. We may document both information in brief in the relevant Column 10 (Person in charge of implementation) and Column 11 (Implementation Time Plan) of our template. We can also use Column 12 (Notes) to document our notes on the specific project/change/system.
Ostermann, C. M., Nascimento, L. da S., Steinbruch, F. K., & Callegaro-de-Menezes, D. (2021). Drivers to implement the circular economy in born-sustainable business models: a case study in the fashion industry. Revista de Gestão, ahead-of-print (ahead-of-print). https://doi.org/10.1108/rege-03-2020-0017
Gusmerotti, N. M., Testa, F., Corsini, F., Pretner, G., & Iraldo, F. (2019). Drivers and approaches to the circular economy in manufacturing firms. Journal of Cleaner Production, 230, 314–327.
Konar, S., Cohen, M.A. (2001). Does the market value environmental performance? Review of Economics and Statistics, 83 (2), 281-289.
Miles, M.P., Covin, J.G. (2000). Environmental marketing: A source of reputational, competitive, and financial advantage. Journal of Business Ethics, 23 (3), 299-311.
Tura, N., Hanski, J., Ahola, T., Ståhle, M., Piiparinen, S., & Valkokari, P. (2019). Unlocking circular business: A framework of barriers and drivers. Journal of Cleaner Production, 212, 90-98.
Vermunt, D. A., Negro, S. O., Verweij, P. A., Kuppens, D. V., & Hekkert, M. P. (2019). Exploring barriers to implementing different circular business models. Journal of Cleaner Production, 222, 891-902.
Agyemang, Martin & Kusi-Sarpong, Simonov & Khan, Sharfuddin & Mani, Venkatesh & Rehman, Syed & Kusi-Sarpong, Horsten. (2019). Drivers and barriers to circular economy implementation: An explorative study in Pakistan’s automobile industry. Management Decision. 57. 971-994. 10.1108/MD-11-2018-1178.
Droege, H., Raggi, A., Ramos, T.B. (2021). Overcoming Current Challenges for Circular Economy Assessment Implementation in Public Sector Organisations. Sustainability, 13, 1182. https://doi.org/10.3390/su13031182
Schröder, P., Albaladejo, M., Alonso Ribas, P., MacEwen, M. and Tilkanen, J. (2020). The circular economy in Latin America and the Caribbean Opportunities for building resilience. Research Paper. Energy, Environment and Resources Programme. Available at: https://www.unido.org/sites/default/files/files/2020-09/circular_economy_lac.pdf
Brown, E.G., Laxmi, H., Schröder, A., Bozkurt, Ö., Bachus, K. (2021); Closing the skills gap: vocational education and training for the circular economy. Goldschmeding Foundation voor Mens, Werk en Economie
de Mattos, C. A., & de Albuquerque, T. L. M. (2018). Enabling factors and strategies for the transition toward a circular economy (CE). Sustainability (Switzerland), 10(12).
Govindan, K. & Hasanagic, M. (2018). A systematic review on drivers, barriers, and practices towards circular economy: a supply chain perspective, International Journal of Production Research, 56:1-2, 278-311
Heshmati, A. (2015) : A Review of the Circular Economy and its Implementation, IZA Discussion Papers, No. 9611, Institute for the Study of Labor (IZA), Bonn
Tura, N., Hanski, J., Ahola, T., Ståhle, M., Piiparinen, S., & Valkokari, P. (2019). Unlocking circular business: A framework of barriers and drivers. Journal of Cleaner Production, 212, 90-98.
Auriault, C., Aze, F., Morgan, J., Sopelana Gato, A., Fifer Bizjak, K., Mauko, A., Mladenovic, A., Feirrera, V., Canas Rojas, A., Costa Branco, P.M., de Oliveira Rodrigues, P., Cepria Pamplona, J.J. (2017). Comprehensive analysis of the existing and emerging approaches of circular economy models in pulp and paper industry. Paper Chain, 22-23.
Cruz, C. I. (2019). Factors that affect Circula Economy. A qualitative study of the supply chain of food and beverage plastic packaging in the Netherlands. Amsterdam, Netherlands: IVM Institute for Environmental Studies.
Jensen, K. G. (2016). Building a Circular Future. Danish Environmental Protection Agency.
Tura, N., Hanski, J., Ahola, T., Ståhle, M., Piiparinen, S., & Valkokari, P. (2019). Unlocking circular business: A framework of barriers and drivers. Journal of Cleaner Production, 212, 90-98.
Chesbrough, Henry W. (2003) Open Innovation – The New Imperative for Creating Profiting from Technology, Harvard business school press, https://www.researchgate.net/publication/232957368_Open_Innovation_Researching_A_New_Paradigm , last access 03.07.2021.
Ciulli, F., Kolk, A. & Boe-Lillegraven, S. (2020), Circularity Brokers: Digital Platform Organizations and Waste Recovery in Food Supply Chains. J Bus Ethics 167, 299–331) https://doi.org/10.1007/s10551-019-04160-5, last access 03.07.2021.
Dias, Rui; Azevedo, João; Estrela, Marco & Henriques, Juan (2020), SCALER - GUIDELINES FOR INDUSTRIAL SYMBIOSIS, Synergy Technical Implementationwww.scalerproject.eu, last access 03.07.2021
de Mattos, C. A., & de Albuquerque, T. L. M. (2018). Enabling factors and strategies for the transition toward a circular economy (CE). Sustainability (Switzerland), 10(12).
Govindan, K. & Hasanagic, M. (2018). A systematic review on drivers, barriers, and practices towards circular economy: a supply chain perspective, International Journal of Production Research, 56:1-2, 278-311
Heshmati, A. (2015) : A Review of the Circular Economy and its Implementation, IZA Discussion Papers, No. 9611, Institute for the Study of Labor (IZA), Bonn
SCALER PROJECT (2018), Lessons learnt & best practices for enhancing industrial symbiosis in the process industry, www.scalerproject.eu, last access 03.07.2021.
Tura, N., Hanski, J., Ahola, T., Ståhle, M., Piiparinen, S., & Valkokari, P. (2019). Unlocking circular business: A framework of barriers and drivers. Journal of Cleaner Production, 212, 90-98.
Bressanelli G, Perona M, Saccani N. (2019). Challenges in supply chain redesign for the Circular Economy: a literature review and a multiple case study. International Journal of Production Research, 57(23):7395–422.
de Vargas Mores G, Finocchio CPS, Barichello R, Pedrozo EA. (2018). Sustainability and innovation in the Brazilian supply chain of green plastic. Journal of Cleaner Production, 177:12–8.
Ghisellini P, Cialani C, Ulgiati S. (2016). A review on circular economy: the expected transition to a balanced interplay of environmental and economic systems. Journal of Cleaner Production, 114:11–32.
Govindan K, Hasanagic M. (2018). A systematic review on drivers, barriers, and practices towards circular economy: a supply chain perspective. International Journal of Production Research, 56(1–2):278–311.
Gumley W. (2014). An Analysis of Regulatory Strategies for Recycling and Re-Use of Metals in Australia. Resources, 3(2):395–415.
Kissling R, Coughlan D, Fitzpatrick C, Boeni H, Luepschen C, Andrew S, et al. (2013). Success factors and barriers in re-use of electrical and electronic equipment. Resources, Conservation and Recycling, 80:21–31.
Moreno M, Braithwaite N, Cooper T. Moving beyond the circular economy. In Going Green-Innovation Conference. Vienna, Austria.
Ormazabal M, Prieto-Sandoval V, Puga-Leal R, Jaca C. (2018). Circular Economy in Spanish SMEs: Challenges and opportunities. Journal of Cleaner Production, 185:157–67.
Tura N, Hanski J, Ahola T, Ståhle M, Piiparinen S, Valkokari P. (2019). Unlocking circular business: A framework of barriers and drivers. Journal of Cleaner Production, 212:90–8.
Vermunt DA, Negro SO, Verweij PA, Kuppens DV, Hekkert MP. (2019). Exploring barriers to implementing different circular business models. Journal of Cleaner Production, 222:891–902.
Olabode E. Ogunmakinde, William D. Sher & Kim Maund, Circular Construction: Opportunities and Threats, School of Architecture and Built Environment, University of Newcastle, NSW, Australia. May 4-5, 2017, Project Management Symposium Papers, ISSN 2374-9377. Corresponding email: olabode.ogunmakinde@uon.edu.au
Vasileios Rizos, Arno Behrens, Terri Kafyeke, Martin Hirschnitz-Garbers & Anastasia Ioannou, The Circular Economy: Barriers and Opportunities for SMEs, CEPS Working Document, No. 412 / September 2015, ISBN 978-94-6138-479-9, www.ceps.eu
ESI international in association with “The George Washington University”, Risk Management, Project Management Development Program, April 2000.
Risk Management, chapter 11, A Guide to the Project Management Body of Knowledge (PMBoK GUIDE), 6th Edition, 2017, ISBN 978-1-62825-184-5.
Garza-Reyes, J.A., Kumar, V., Batista, L., Cherrafi, A. and Rocha-Lona, L. (2019), "From linear to circular manufacturing business models", Journal of Manufacturing Technology Management, Vol. 30 No. 3, pp. 554-560. https://doi.org/10.1108/JMTM-04-2019-356
Milios, Leonidas, Overarching policy framework for product life extension in a circular economy—A bottom-up business perspective (2021), International Institute for Industrial Environmental Economics, Lund University, Lund, Sweden https://onlinelibrary.wiley.com/doi/full/10.1002/eet.1927
Fillis I. The Internationalizing Smaller Craft Firm: Insights from the Marketing/Entrepreneurship Interface. International Small Business Journal. 2004 Feb 1;22(1):57–82.
UNITED NATIONS. UNITED NATIONS CONFERENCE ON TRADE AND DEVELOPMENT. CREATIVE ECONOMY OUTLOOK Trends in international trade in creative industries. 2018. Report No.: UNCTAD/DITC/TED/2018/3.
Zhan X, Walker S, Hernandez-Pardo R, Evans M. Craft and Sustainability: Potential for Design Intervention in Crafts in the Yangtze River Delta, China. The Design Journal. 2017 Jul 28;20(sup1):S2919–34.
Lacy P, Long J, Spindler W. How to Make the Circular Pivot. In: Lacy P, Long J, Spindler W, editors. The Circular Economy Handbook: Realizing the Circular Advantage [Internet]. London: Palgrave Macmillan UK; 2020 [cited 2021 Dec 2]. p. 205–13. Available from: https://doi.org/10.1057/978-1-349-95968-6_16
This website uses cookies to improve your experience. Necessary cookies ensure the smooth performance of the website and are definitely employed when the website is being used. Cookies from third parties are only activated for tracking purposes when you click on “Accept”. Read our Privacy Policyfor more information about what we do with your data and how to manage cookies.
Functional
Always active
The technical storage or access is strictly necessary for the legitimate purpose of enabling the use of a specific service explicitly requested by the subscriber or user, or for the sole purpose of carrying out the transmission of a communication over an electronic communications network.
Preferences
The technical storage or access is necessary for the legitimate purpose of storing preferences that are not requested by the subscriber or user.
Statistics
The technical storage or access that is used exclusively for statistical purposes.The technical storage or access that is used exclusively for anonymous statistical purposes. Without a subpoena, voluntary compliance on the part of your Internet Service Provider, or additional records from a third party, information stored or retrieved for this purpose alone cannot usually be used to identify you.
Marketing
The technical storage or access is required to create user profiles to send advertising, or to track the user on a website or across several websites for similar marketing purposes.


 A Priority Matrix is a grid-style “traffic light system” that you can use to help visualize the ratings of your projects. Traffic light colours are used to distinguish between the priorities of the projects and help you define your projects/changes/systems implementation prioritisation better. The scale starts with green (for the least important) and finishes with red (for the most significant and of key priority).

